First find where the frame is actually stuck: CPU, Render Thread, or GPU. Then pick the right tool instead of guessing.
Editor-viewport numbers lie. Before trusting any measurement: disable VSync and frame limits (t.MaxFPS 0, VSync off), build lighting, profile in Standalone or a packaged Test build (Development builds carry overhead; Shipping hides the stats), test a repeatable camera path, and let shaders finish compiling first.
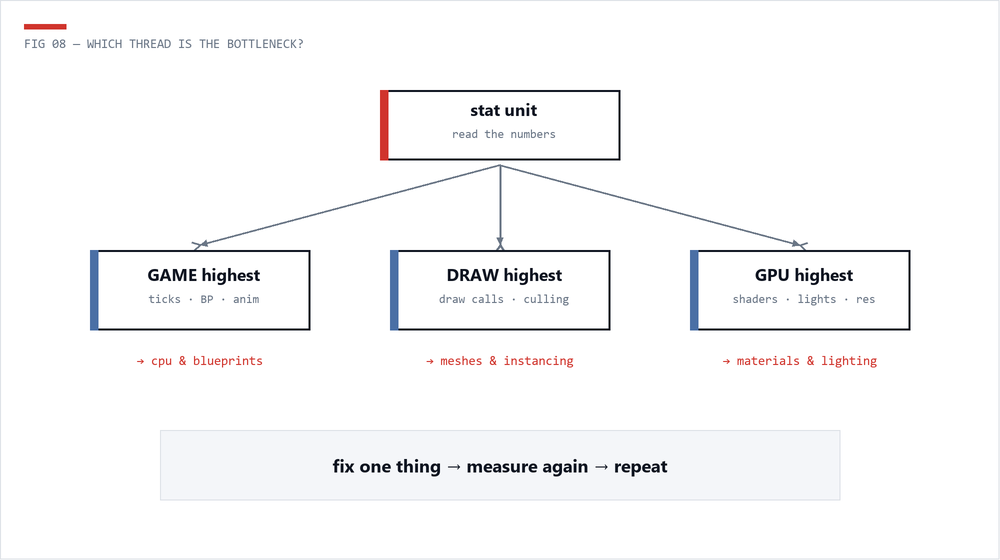
stat unit -> Frame / Game / Draw / GPU times
stat gpu -> per-pass GPU costs
stat game -> game thread breakdown
stat scenerendering -> draw calls, render thread detail
stat streaming -> texture pool pressure
memreport -full -> memory snapshot to log
Read stat unit like this: Frame is total; whichever of Game (game thread - gameplay, BP, animation), Draw (render thread - draw call submission), or GPU is closest to Frame is your bottleneck. The other numbers are effectively waiting.
| Bound on | Typical causes | Go to |
|---|---|---|
| Game | Ticks, Blueprint logic, animation, physics, spawning | CPU & Blueprints |
| Draw | Too many draw calls / components / dynamic shadows | Meshes & LODs |
| GPU | Shaders, overdraw, lighting, shadows, resolution, post | Materials / Lighting |
stat gpu (or ProfileGPU / Ctrl+Shift+,) breaks the GPU frame into passes: BasePass (opaque materials), Shadow Depths, Lumen, Nanite, Translucency, Post Processing. The biggest number tells you which chapter of this section to read. For pixel-level forensics, capture a frame in RenderDoc or PIX.
For anything beyond triage, Unreal Insights records a full timeline trace (-trace=default on launch, or the Trace bar in editor). It answers the questions stat overlays can't: what exactly ran this frame, in what order, on which thread, and how long each scope took. Hitches that vanish when you look at averages are found here.
stat streaming shows texture pool pressure; memreport -full dumps a full breakdown; the Size Map shows per-asset footprints. Blurry textures usually mean the streaming pool is over budget - fix texture sizes before raising the pool. Reference chains (that innocent prop Blueprint hard-referencing half the game) are found with the Reference Viewer - or the Asset Health Dashboard.
Save a baseline trace and stat screenshot before any optimization pass. You can't prove a win without a before.
 The Technical Artist